

Everyone is talking about donor attrition: “We had this many donors, and now we have this many. We lost 40%.” That is an important figure to know.
But that does not tell the whole story.
In fact, in Jeff’s and my mind it doesn’t tell the most important story, which is: “what happened with the donors on your caseload who gave last year and this year, and how did their giving change?” That, my friend, is the more critical question for you as a MGO.
Let me illustrate what I mean in the chart below:
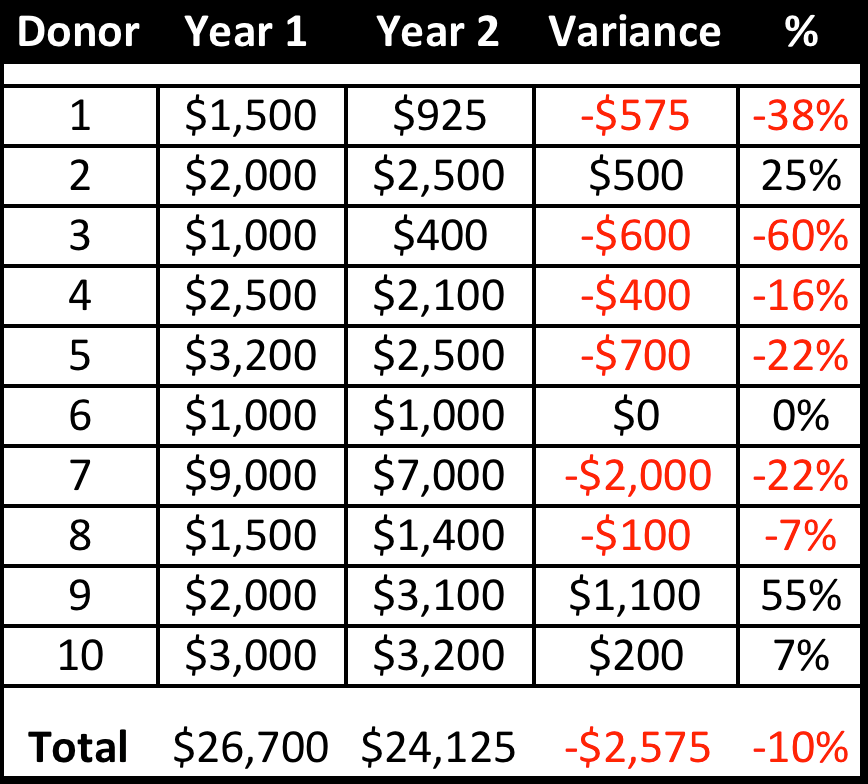
Here we have 10 donors on a caseload who gave a total of $26,700 in year one. At Veritus we normally do this analysis by grouping donors who gave $1,000 cumulatively in one year and see what that same group of donors did in the following years. In this illustration, you see that this same group of donors gave $24,125 in year two – or $2,575 less than year one – for a 10% drop in value. We call that drop “value attrition.”
Note that, in this case, there was zero donor attrition. All the donors are still giving. So any donor attrition calculation would not be useful here. And if all you did was measure donor attrition you would miss the very important information that comes out of value attrition analysis.
For instance:
- Six donors have gone backwards in value. Why? You need to know why for each of them.
- While some are losing value at a single-digit rate, there are several who are at double digits, and that is alarming. What was the strategy used with these donors? Is something wrong? What else can you do?
- In one case the donor gave the same amount. Does this mean that the donor cannot or will not give any more? Or is the giving relationship with you one that is more “maintenance” than it is one of bringing joy to the donor? Flat giving year after year can mean that the donor is giving an obligatory gift rather than being personally involved with the cause of your organization. Or maybe they are meeting a membership threshold you have set, like “Give $X and you become part of our special giving club.” This is not good. That kind of giving is more about the membership criteria than engaging the cause or addressing a societal problem.
At least once a year, you need to do a value attrition analysis of your caseload donors. It is quite simple to do. Here are the steps:
- At the end of the calendar year, when all the books are closed and all the donor giving has been entered into your system, print out a report that lists all the donors on your caseload – their ID number in the first column (so you can look them up), their name in column 2, what they gave three years ago in column 3, two years ago in column 4, last year in column 5, the most recent full year in column 6 and lifetime giving in column 7.
- Total each column, and note how the totals for each year have changed, either up or down. Draw conclusions about that.
- Then look at the variances for each donor and, for each donor (no matter whether they went up or down) be able to answer the question: “WHY did this happen?”
- Learn from your answers and apply them to your strategy. If the donor’s giving went down and you can do something different to affect the outcome this coming year, do it. If they went up, take that learning and apply it to other donors as well.
Looking at your caseload this way will keep you focused and more strategic in how you treat each donor on your caseload. And in the long run, it will increase giving.
Richard
PS – If you want to learn more about how to analyze donor and donor value attrition at your organization, we hope you’ll join us for a free webinar on Finding the Hidden Problem in Your Major Gift Program happening on Thursday, January 13th at 1pm Eastern.
PPS – Skip ahead and get started on your free donor file assessment today! Just fill out the form on this page to get the process started.
This blog post originally appeared on the Passionate Giving Blog on May 29, 2017.
Related Posts
-

How to Measure Missing Money from Donors
May 29, 2017
-
How to Qualify Donors: The First Step – A Caseload Pool
April 6, 2016
-

Four Things I Don’t Understand About Major Gift Naysayers
June 28, 2021


0 Comments